First, the honest part: there are no universal benchmarks
You have probably seen claims such as "first response time should be under so many minutes" or "resolution rate should reach such-and-such percent". We quote none of them, for three reasons.
- Industries differ. A cake shop's questions can mostly be answered in one line; a renovation firm has to estimate every job. Comparing the two means nothing.
- Definitions differ. Under the same name "resolution rate", some people divide by all conversations and others only by the conversations the AI handled.
- Sources are unclear. Many figures cannot be traced to an original survey, and you cannot tell whether shops like yours were in the sample.
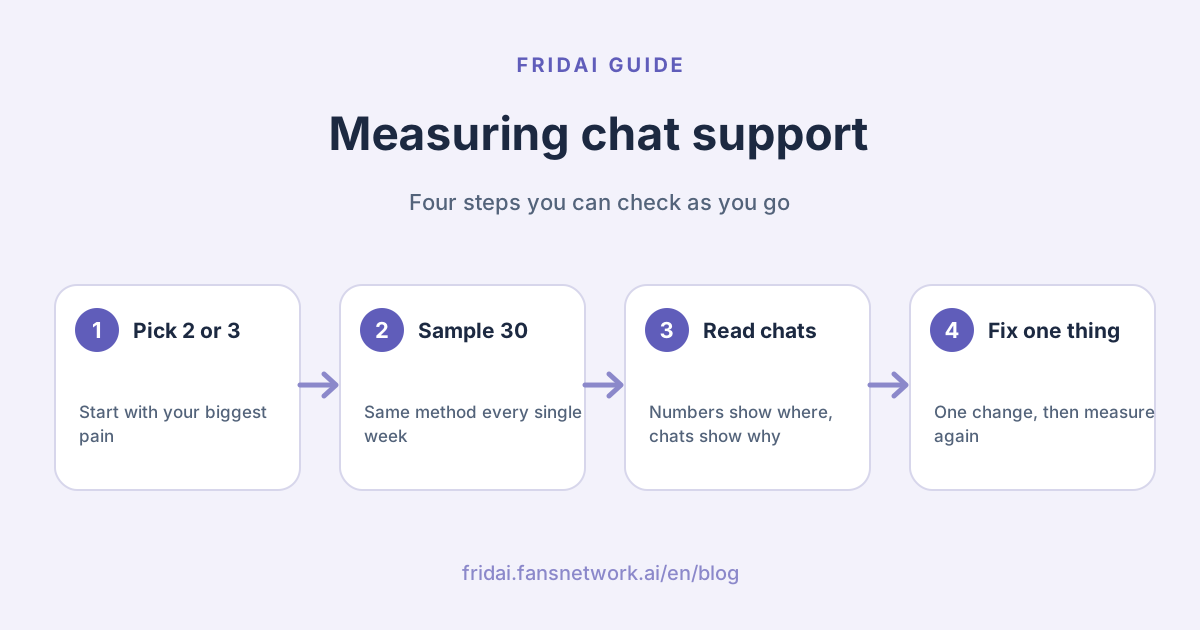
So how do you measure customer service fairly? Establish your own baseline first, then watch the direction. Calculate with the same method for four weeks in a row and from week five you have a line of your own, which is more accurate than anyone else's number.
One more principle: watch two or three metrics at a time. Chase all eight at once and the usual result is that nobody looks at any of them.
The 8 customer service metrics in one table
The "what bad looks like" column deliberately contains no numbers. It describes what you will see in the conversations.
| Metric | Formula | What bad looks like | First fix |
|---|---|---|---|
| First response time | Time of first reply minus time of customer's first message | Customer sends "anyone there?" three times | Decide who watches messages in which time slot |
| Resolution time | Time closed minus time of customer's first message | One issue is still being asked about days later | Find out whose confirmation it is waiting on |
| Resolution rate | Resolved conversations divided by all conversations | Many chats stop at "let me check" | Fill in the answers that are most often missing |
| Handover rate | Conversations handed to a person divided by all conversations | Simple questions wait for a human | Put fixed answers into knowledge and rules |
| Repeat-contact rate | Repeat contacts on the same issue divided by closed conversations | The same customer asks a second time | Check whether replies gave a next step |
| Missed conversations | Conversations with no reply past your own time limit | Unread messages found the next day | Clear every inbox at two fixed times a day |
| CSAT | Satisfied responses divided by all rating responses | Few people rate, or ratings are polarised | Ask at the moment the issue is closed |
| Conversations-to-order | Orders divided by conversations opened | Silence after the quote | Attach a next step to every quote |
Which metrics first? Pick by what hurts most right now
You do not have to start all eight together. Ask one question: what do customers complain about most this month? Pick from there.
| Your situation | Watch these two first | Can wait |
|---|---|---|
| Messages often answered the next day | Missed conversations, first response time | Conversations-to-order |
| Customers keep asking about the same thing | Repeat-contact rate, resolution rate | First response time |
| You have just introduced AI customer service | Spot-check accuracy, handover rate | CSAT |
| Lots of enquiries, few orders | Conversations-to-order, resolution time | Handover rate |
| Complaints are rising | Resolution time, CSAT | Conversations-to-order |
Once you have chosen, watch for four weeks. Do not switch metrics because one week looks bad. A metric is a bathroom scale, not a diet pill: weighing yourself does not make you lighter, but without it you cannot tell whether you are heading the right way. When those two numbers are stable and the weekly review has become a habit, add the next pair.
No helpdesk? Sample 30 conversations a week
The back ends of LINE (the dominant messaging app in Taiwan), Instagram and Facebook will not hand you these eight numbers in one report. That is fine. A manual sample does the job and takes about as long as a cup of coffee each week.
Three sampling rules
First, fix the method. For example ten conversations per platform, or a set number per day. Once decided, do not change it. Sampling LINE this week and Instagram next week gives you two numbers that cannot be compared.
Second, do not cherry-pick. Take every few conversations from the top of the inbox downward. Do not choose only the smooth ones, and do not choose only the arguments.
Third, one conversation is one issue. The same customer asking about a booking and then parking on the same day is one conversation; coming back three days later about something else is a new one. If last week had fewer than 30 conversations, log them all.
Log sheet template
Paste this into a spreadsheet and fill one row per conversation.
[Customer service conversation sample log]
No. | Platform | Customer's first message (time) | First reply (time) | Who replied first (AI / person) | Handed to a person? | Resolved? (yes / no / waiting) | Closed (time) | Repeat contact? | Order placed? | Notes
1 | LINE | | | | | | | | |
2 | Instagram | | | | | | | | |
3 | Facebook | | | | | | | | |
The eight metrics, one by one
1. First response time
How long it takes from the customer's first message until they receive the first reply with real content.
First response time = time of first substantive reply − time of customer's first message
Weekly figure = median of the 30 conversations (sort from shortest to longest, take the middle one)
How to collect it: read the timestamps in the conversation, enter them in the log sheet and subtract. Calculate business hours and out-of-hours separately.
How it misleads: an average gets dragged around by one or two overnight conversations, so use the median. Also, "Hello, we will reply shortly" is not a substantive reply. An instant empty line makes the number look good while the customer is still waiting.
2. Resolution time
From the moment the customer speaks up until the issue is truly finished.
Resolution time = time closed − time of customer's first message
Closed = the customer has the answer or has completed the next step, and has not asked about the same issue again
How to collect it: use the time of the last effective reply as the closing time. Leave unclosed conversations out and count them separately.
How it misleads: a short resolution time does not prove good work. It may just mean the hard cases were left open. Always read it next to the number of conversations still "waiting".
3. Resolution rate
Of the conversations sampled, how many actually dealt with the customer's issue. If you use AI, also calculate a second figure: resolved without handover.
Resolution rate = resolved conversations ÷ conversations sampled
Resolved without handover = conversations resolved with no handover to a person ÷ conversations sampled
How to collect it: have the same person judge each conversation as yes, no or waiting. Write the criteria down so anyone else applies the same ones.
How it misleads: a customer who stops replying is not necessarily resolved. They may have given up. This is the box where resolution rates get inflated most often; when in doubt, count it as "no".
4. Handover rate
How many conversations had to pass from auto-replies or AI to a person.
Handover rate = conversations handed to a person ÷ conversations sampledHow to collect it: the "Handed to a person?" column in the log sheet, with the reason in the notes.
How it misleads: neither high nor low is good or bad in itself. Too high may mean the knowledge has too many gaps; too low may mean complaints that should have been handed over were absorbed by the AI. What matters is whether the conversations that were handed over really needed a person.
5. Repeat-contact rate
The share of customers who come back a second time about the same issue.
Repeat-contact rate = conversations where the customer returned about the same issue within your chosen number of days ÷ closed conversationsHow to collect it: choose the number of days yourself and then keep it fixed. When sampling, scroll back to that customer's previous conversation and check whether it is the same issue.
How it misleads: a customer returning with a new question is a good thing and does not count. Only "you said you would get back to me and did not" and "I could not understand the last answer" count.
6. Missed conversations
Conversations that nobody has answered past the time limit you set yourself.
Missed conversations = conversations with no reply past your own time limit
Missed rate = missed conversations ÷ all incoming conversations
How to collect it: do not sample this one. Open each platform's inbox every day and count unread and unanswered conversations. The time limit is yours to set, for example how long during business hours, and by what time overnight messages must be cleared.
How it misleads: counting only unread messages misses the ones that were read and never answered. On Meta's platforms a miss also has a practical consequence: the Messenger Platform policy states that businesses have up to 24 hours to respond to a user, and after that, sending a message has to meet other rules such as message tags.
7. Customer satisfaction (CSAT)
Ask the customer directly whether they were satisfied with this interaction.
CSAT = number of satisfied responses ÷ number of people who gave a rating
Rating response rate = number of people who gave a rating ÷ number of people asked
How to collect it: send one short message when you close the issue, for example "Did this reply help? Send 1 for yes, 2 for no." Define in advance what counts as satisfied and do not change it later.
How it misleads: when only a few people respond, the score describes those few people. Always read CSAT together with the rating response rate. If you only ask customers who seem happy, what you get is comfort, not a metric.
8. Conversations-to-order
Only for shops that can track orders.
Conversations-to-order = orders ÷ conversations openedHow to collect it: define what counts as an order first, then make each entry point distinguishable. We covered how in the conversational commerce guide and will not repeat it here.
How it misleads: not every conversation is a purchase enquiry. In a week with many after-sales questions this ratio drops although the service has not got worse.
After you add AI, read your KPIs differently
The moment AI goes live, first response time looks excellent automatically, because the AI does not sleep. Keep staring at speed and you are staring at a number that will never tell you anything again. Measuring AI customer service means shifting attention to two things: whether the answers are right, and whether the handover is good.
| Metric | After AI goes live | Watch this instead |
|---|---|---|
| First response time | Almost certainly shorter | Whether the first reply answers the question |
| Resolution rate | May rise, or may be inflated | Accuracy from a human spot check |
| Handover rate | Moves with how strict the rules are | How long until a person picks up |
| Repeat-contact rate | Rises when answers miss the point | Whether customers rephrase and ask again |
| Missed conversations | Fewer during auto-reply hours | Handovers nobody picked up |
Handover quality deserves one more number:
Handover wait time = time of the person's first reply − time the AI handed overBelow is an AI spot-check sheet. Every week, sample a fixed number of conversations the AI answered and have a person judge each one.
[AI reply spot-check sheet]
No. | What the customer asked | Was the AI's answer correct? (right / partly / wrong) | Did it come from approved knowledge? | Did it promise anything it should not? | Did it hand over when it should have? | Did it tell the customer about the handover? | How long until a person took over? | Knowledge or rule to fix
1 | | | | | | | |
2 | | | | | | | |
3 | | | | | | | |Every "wrong" must map to something in the last column. How to test before and after launch, and when not to adopt AI at all, is laid out with a full test matrix in AI customer service implementation: 9 questions to ask first. For how to change the rules, see how to write AI customer service rules.
The weekly review fits on one page
Numbers without a review are numbers you did not need to calculate. No slides required; one page is enough.
[Weekly customer service review]
Week: Reviewer: Conversations sampled:
1. This week's numbers (last week in brackets)
Median first response time: ( )
Resolution rate: ( )
Handover rate: ( )
Repeat-contact rate: ( )
Missed conversations: ( )
CSAT and rating response rate: ( )
Conversations-to-order: ( )
2. The one metric that changed most:
3. Which conversations we read, and the line where the customer stopped:
4. The one thing we change this week:
5. Who owns it, and done by which day:
6. Did last week's change work:Please write only one item under point 4. Change five things in a week and when the numbers move next week you will not know which change earned it.
Common pitfalls and how to avoid them
- Tying KPIs straight to bonuses. People start managing the numbers, for example racing to send an empty first line or marking hard conversations as resolved.
- Watching only speed. An instant wrong answer is just a more efficient way of making a mess.
- Changing the formula every week. Once the denominator changes, before and after cannot be compared; if you must change it, start a new baseline.
- Calculating without reading. Numbers tell you where things got worse. The reason is in the conversations.
- Looking at each platform separately and never adding up. A customer who gets no answer on Instagram and asks again on LINE looks normal on both sides. For how to organise across platforms, see the omnichannel customer service guide.
- Treating complaint volume as a bad metric. A customer who is willing to tell you is giving you a chance; how to handle it is in the complaint handling guide.
FAQ
Is there an industry standard for customer service KPIs?
There is no standard that fits every shop. Industry, question difficulty and formulas all differ, so someone else's number rarely holds in your shop. The more reliable approach is to measure your own baseline for four weeks and then watch which way each week moves.
How fast does first response time need to be?
There is no universal pass mark. Set your own target based on opening hours and staffing, and put it in your welcome message so customers know. Speed is not the only point: the first reply has to actually answer the question to count.
How do I measure customer service without a helpdesk?
Sample 30 conversations on a fixed day each week and log, in a spreadsheet, the time of the first message, the time of the first reply, whether it was resolved and whether it was handed to a person. That covers most metrics. For missed conversations, check each platform's inbox daily for unread and unanswered messages.
Why is my resolution rate high while customers still complain?
The usual causes are counting customers who stopped replying as resolved, or counting "we replied" as "we solved it". Read it together with the repeat-contact rate and the actual conversations, and count any doubtful conversation as unresolved.
How should I ask for CSAT so that customers actually answer?
Ask right after the issue is dealt with, with a single question that can be answered with one digit. Do not ask only the customers who seem pleased, and record the rating response rate too. When very few people respond, treat the score as a hint only.
With AI customer service, does a high handover rate mean failure?
Not necessarily. Early on, more handovers are better than an AI that forces an answer. What to check is whether the handed-over conversations really needed a person and how long a person took to pick up. If simple questions keep being handed over, go back and fill in knowledge and rules.
Does a small shop need to track every metric?
No. Start with the two or three most related to your biggest current problem. If messages are often missed, begin with missed conversations and first response time. Once those are stable, move on to the next set.
How FRIDAI can help
Metrics are for finding problems; once found, a person or a system still has to handle the conversation well. FRIDAI Chat connects to your LINE, Instagram and Facebook DMs, replies based on the AI rules and knowledge you write, notifies a person to take over when needed and stays out of the way while the person replies. Conversations are kept on record, so the spot-check sheet above can be used as is.
- DM customer service: FRIDAI Chat
- Before you adopt AI: AI customer service implementation: 9 questions to ask first
- Reply templates: 36 customer service reply templates
- Template index: Customer service message templates: an index of 8 types
- Instagram: FRIDAI on Instagram
- Threads: FRIDAI on Threads
- Facebook: FRIDAI on Facebook
Official sources
- Meta: Messenger Platform Policy Overview: developers.facebook.com/
docs/ messenger-platform/ policy/ policy-overview - FRIDAI Chat: fridai.fansnetwork.ai/
fridai-chat